PREDICTING PLAYERS' FINISH PLACEMENT IN
PLAYERUNKNOWN'S BATTLEGROUNDS

Final project for JHU 140.711 Advanced Data Science (Fall 2018)
Albert Kuo and Athena Chen

About PlayerUnknowns' Battlegrounds (PUBG)

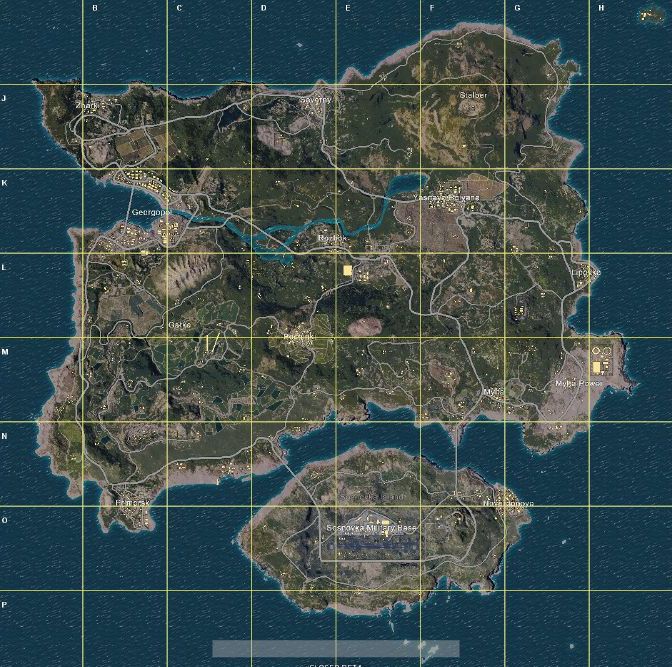
Around one hundred players jump out of a plane with no items. Players must loot for weapons and other items to survive. Who will be the last player standing?

Battle royale games have surged in popularity in recent years. The premise of such games is as follows: players are dropped onto a fictional island and fight to be the last person standing. As they roam around the island, they loot for weapons and items crucial for their survival. Players can choose to join a game as a solo player or with a group of friends (4 players maximum). When playing solo, players are immediately eliminated when they are killed. Players not only have to worry about getting killed by other players, but they also have to stay within the shrinking "safe zone," which effectively forces players into contact with each other. Outside of the "safe zone," players take damage to their health at increasing rates.

PUBG_MAP

WHAT DETERMINES A PLAYER'S FINAL MATCH PLACEMENT?

The main goal of this project is to predict a solo player's finish placement based on their in-game actions. Specifically, we wanted to answer:

  1. How well can we predict who will win the game?
  2. What player actions or features are most predictive of their finish placement?

The Data

This project was inspired by a Kaggle competition to predict player finish placement for various PUBG game data and was provided by the team at PUBG. Thus, the data can be downloaded via the Kaggle API. In this project, we opted to focus only on match data for solo-players. Additionally, due to computational costs, we only looked at a small subset of the full dataset provided by Kaggle. We first explored the distribution of each feature by the final finish percentile. Players were grouped into the 0-19th, 20th-39th, 40th-59th, 60th-79th, or 80th-100th percentile finish. Then we plotted the density of features by percentile groups. This gives some indication of how predictive our features will be. Note that due to extreme outliers, we excluded the highest 1% of many of the features for clearer visualizations. The subsetted data set consists of:

  • 99040

    Players
    • 1058

      Games Played
      • 16

        Features
        • 100

          Percent of Players with Data Per Match
Learn More About the Data

Predicting Players' Final Placement

To answer our motivating questions, we explored three prediction models based on linear regression, penalized general linear regression, and random forest. Parameter tuning was done using 5-fold cross-validation. We then evaluated the performance of each model using the mean absolute error, self-defined accuracy metric, and accuracy for classification of winners. The best model, based on the performance evaluation, predicted finish percentiles within ~5% of the true finish percentile on average (mean absolute error). Additionally, half of all predicted finish percentiles were within ~3% of the true finish percentiles (median absolute error). Furthermore, we looked at the relative importance of player features in predicting final player percentile.

Read More About How We Analyzed the Data

Key Takeaways

Prediction Accuracy

On average, our predicted final placement percentiles were within 5% of the true values.

Kills and Damage

Features related to kills and damage were most predictive of winners and finish percentiles.

Boosts

The second most predictive features were items acquired in the game, specifically boosts and weapons.